
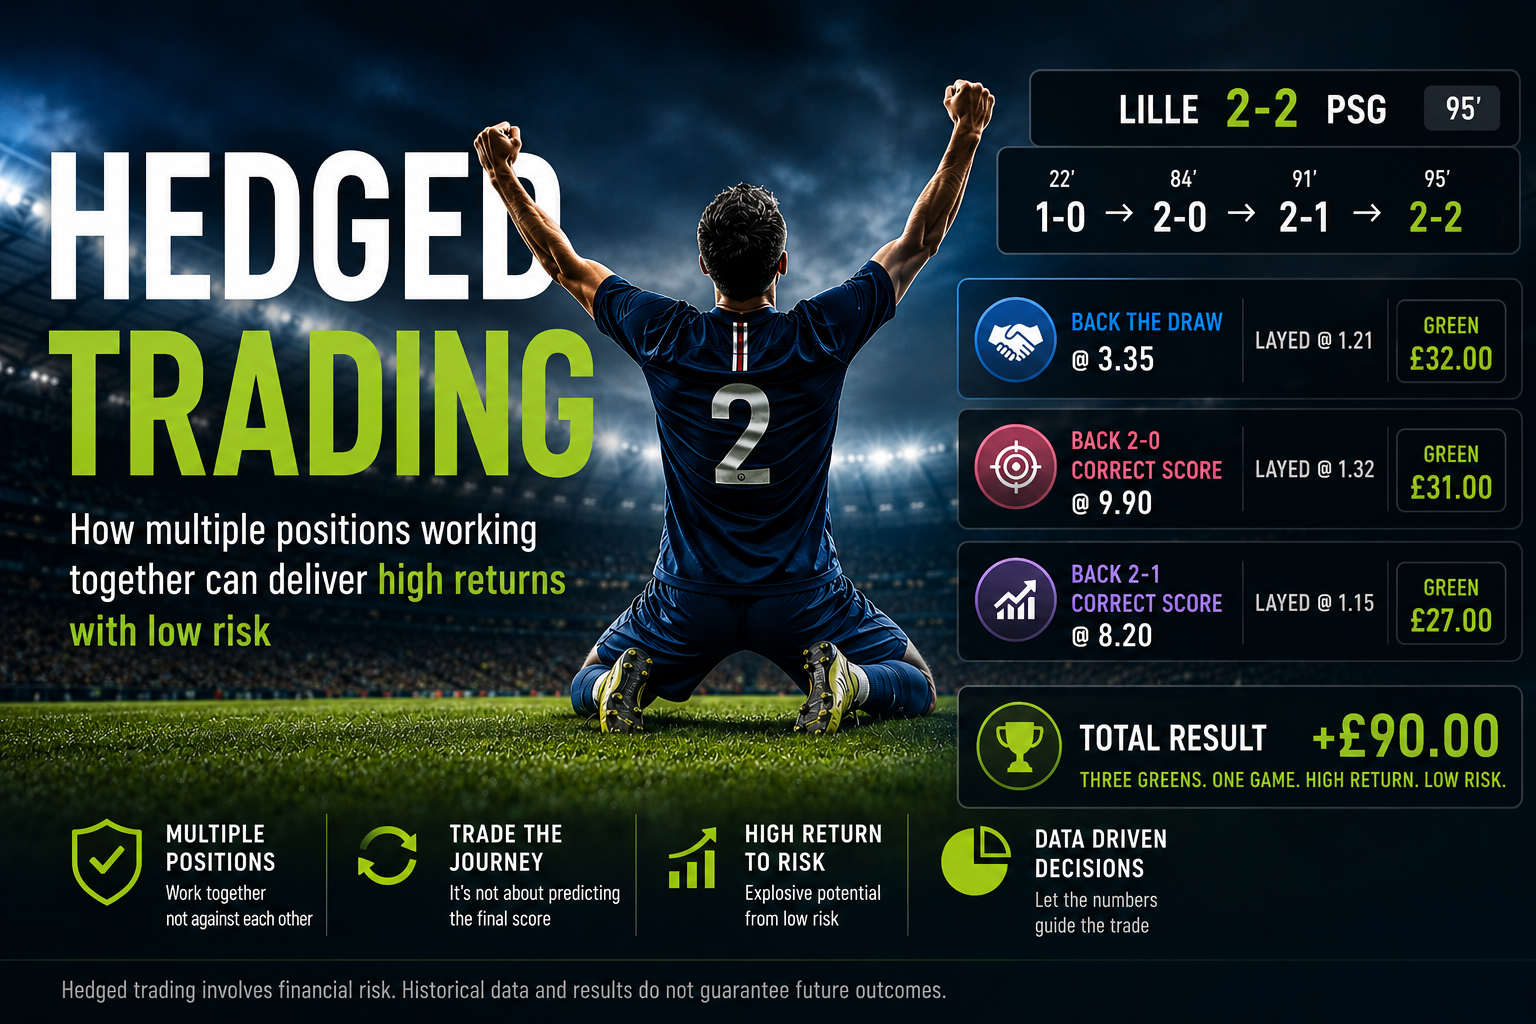
How multiple positions can work together to create high return-to-risk trading opportunities
Hedged Trading is very different from simply placing a bet and waiting to see whether it wins or loses.
The objective is to construct a series of positions across different markets which can work with and against each other as the match develops.
Rather than relying on one final outcome, we are looking for a match to travel through a series of possible pathways.
Those pathways can create opportunities to trade individual positions into green, reduce them to low red, or potentially remove the original risk altogether.
The key is that we establish the potential pathways before entering the trade.
We want to know:
- What has to happen for each position to shorten?
- How quickly could we potentially remove our risk?
- Which scorelines work in our favour?
- Which scorelines work against us?
- What does the historical GameState data tell us about those possibilities?
- Most importantly, is the potential return sufficiently large in relation to the risk being taken?
This is what I mean by Hedged Trading.
It is not simply about predicting the final score.
It is about trading the journey the match takes to get there.
HOW IS THIS DIFFERENT FROM CONVENTIONAL BETTING?
With a traditional bet, the proposition is straightforward.
You select an outcome, place your bet and ultimately either win or lose.
Hedged Trading is different because we can hold two, three or even four positions simultaneously, sometimes in markets that appear to oppose each other.
That is deliberate.
The positions are designed to potentially “collide” as the match develops.
One event may hurt one position but dramatically improve another.
Another goal may then activate a second trade.
If the match continues down a particular pathway, a third opportunity can appear.
The important point is that we don’t necessarily need any of these selections to win at full time.
We need their prices to move.
That distinction is fundamental.
Let me show you a real example.
LILLE v PSG — A HEDGED TRADING CASE STUDY
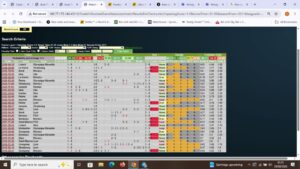
The Betfair position from Lille v PSG, illustrating the Match Odds trade.
Interestingly, this match did not qualify as one of my normal posted selections.
PSG started the match at approximately 1.70.
My normal cut-off is for the favourite to start at 1.65 or below, so this fell just outside my normal parameters.
However, what subsequently happened provides an excellent example of how the Hedged Trading concept works.
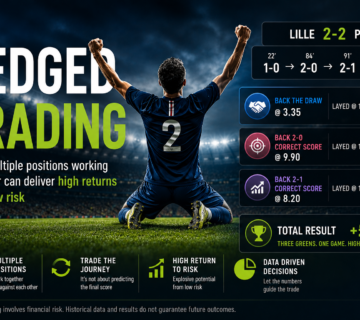
PSG were away from home and went 1–0 behind to Lille.
At approximately 21–22 minutes, we therefore had a strong pre-match favourite trailing 1–0 relatively early in the game.
This created an interesting GameState.
I entered three positions:
Back Draw @ 3.35
Back Lille 2–0 Correct Score @ 9.90
Back Lille 2–1 Correct Score @ 8.20
At first glance, these may appear to be three separate bets.
They weren’t.
They were three components of one overall trading position.
And the historical data explains why.
WHAT DID THE GAMESTATE DATA TELL US?
I had a sample of 28 previous French Ligue 1 matches meeting the relevant criteria.
There were three particularly interesting findings.
1. The identified adverse 1–2 pathway occurred only once
Only 1 of the 28 historical matches reached the identified 1–2 scenario before the specified 65-minute point.
That represents:
1/28 = 3.6%
Conversely, 27 of the 28 — 96.4% — avoided that particular historical losing pathway.
That’s an important distinction.
I’m not claiming that this proves there is a 96.4% probability of success in the next match. Twenty-eight games is a relatively small sample.
What it does tell us is that within the historical sample, the match overwhelmingly followed pathways that offered opportunities to manage the trade rather than the one pathway we particularly wanted to avoid.
That’s exactly the type of GameState information we’re looking for.
2. How often does the weaker home team score again?
This was particularly interesting.
From this 1–0 GameState, the weaker home team subsequently scored a second goal in:
15 of 28 matches = 53.6%
A raw 53.6% probability equates to decimal odds of approximately:
1.87
Now compare that with the prices available in the Correct Score market.
Lille 2–0 was approximately 9.90.
Lille 2–1 was approximately 8.20.
There is an important distinction here.
The 53.6% statistic is not saying that Lille have a 53.6% chance of winning 2–0.
It tells us that in the historical sample, the home team scored another goal in 53.6% of comparable situations.
Why does that matter?
Because we’re trading, not necessarily holding the Correct Score bet until full time.
If Lille score the next goal and make it 2–0, a Correct Score position backed at 9.90 can shorten dramatically.
That gives us the opportunity to lay it back at a much lower price.
And that’s precisely what happened.
THE CORRECT SCORE AT 53% — A HUGE TRADING OPPORTUNITY
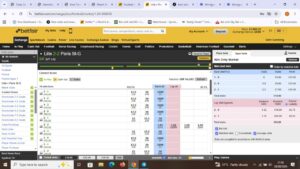
The Correct Score positions showing Lille 2–0 backed at 9.90 and 2–1 at 8.20, together with the subsequent lay trades.
This screenshot demonstrates the concept extremely well.
Lille 2–0 was backed at 9.90.
When the match eventually reached 2–0, the price collapsed.
The first green became available at approximately 1.32, with additional lays positioned below that level.
Look at the scale of that price movement:
BACK 9.90 → LAY 1.32
We didn’t need Lille to win the match 2–0.
We needed the match to reach 2–0 at a sufficiently favourable point for the market to reprice the Correct Score dramatically.
That’s a completely different proposition.
But then something even more interesting happened.
THE SECOND LAYER OF THE TRADE
Our GameState data also showed that the strong away favourite scored at least one subsequent goal in 17 of the 28 matches.
That’s:
17/28 = 60.7%
Therefore, if Lille did reach 2–0, there remained a historically reasonable possibility that PSG would respond.
And we already held:
Lille 2–1 @ 8.20
Again, we’re not necessarily interested in the match finishing 2–1.
We’re interested in it reaching 2–1.
That’s precisely what happened.
NOW WATCH THE MATCH PATHWAY
This is where the idea of the trades “colliding” becomes much easier to understand.
Our entry point was:
22 minutes — Lille 1–0 PSG
We had our three positions waiting.
Nothing spectacular needed to happen.
Then:
84 minutes — Lille 2–0 PSG
Our 2–0 Correct Score trade was activated.
The price that had been backed at 9.90 crashed to around 1.32.
Green opportunity number one.
Then:
91 minutes — Lille 2–1 PSG
Now our second Correct Score position came alive.
The 2–1, originally backed at 8.20, shortened to approximately 1.15.
Green opportunity number two.
But the match wasn’t finished.
95 minutes — Lille 2–2 PSG
PSG equalised.
And now the original Draw @ 3.35 position was sitting on the winning scoreline.
Green opportunity number three.
The match had travelled:
1–0 → 2–0 → 2–1 → 2–2
In doing so, it travelled through all three of our trading positions.
That’s Hedged Trading in action.
WHY THE DRAW POSITION MATTERS
The Draw provides another layer to the structure.
If PSG equalise earlier, the Correct Score positions may suffer, but the Draw position can shorten dramatically.
If Lille instead scores first to make it 2–0, our Correct Score position can shorten.
If PSG subsequently respond and make it 2–1, another position can shorten.
And if PSG eventually equalise, we’re back into our original Draw position.
This is what I mean when I talk about the positions colliding.
We’re not trying to predict one precise sequence.
We’re attempting to construct positions around several plausible pathways.
THE HISTORICAL PICTURE
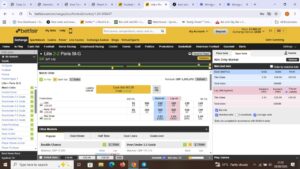
Trade on Sports GameState analysis showing the 28 historical matches used to assess the 1–0 scenario.
This is where the Trade on Sports GameState data becomes particularly valuable.
Rather than saying:
“I think PSG will equalise.”
We can ask much more useful questions.
What normally happens when a strong away favourite finds itself 1–0 down at this stage of a Ligue 1 match?
How frequently does the home side score again?
How frequently does the strong favourite respond?
When do those goals tend to arrive?
Which scoreline pathways occur most frequently?
And, crucially:
What prices is the market offering us to trade those possibilities?
Within this particular 28-match historical sample, 27 of the 28 matches avoided the specific adverse pathway we had identified.
That’s the source of the 96.4% historical figure.
It should not be interpreted as a guarantee that 96.4% of future trades will succeed.
Instead, it gives us evidence with which to construct the trade and assess whether the potential reward justifies the risk.
THE RESULT: +£90 ACROSS THREE GREENS
The eventual result from the positions was approximately:
+£90
But for me, the most interesting part isn’t the £90.
It’s how it was generated.
There was no extraordinary 5–4 scoreline.
There wasn’t a freak sequence of six goals in ten minutes.
The match simply moved:
1–0 → 2–0 → 2–1 → 2–2
Yet because we had established the positions in advance, that relatively ordinary sequence created three separate trading opportunities.
That’s what makes this type of trading so interesting.
RETURN ON RISK — NOT JUST PROFIT
One of the biggest mistakes traders make is focusing entirely on how much they can win.
The more important question is:
How much am I risking to generate that return?
A strategy producing £100 profit from £1,000 of genuine risk is very different from one capable of producing £100 from £30–£50 of controlled risk.
This is why the return-to-risk profile is central to Hedged Trading.
Before entering, I want to understand:
Potential green.
Potential red.
Expected price movement.
Historical match pathways.
Exit points.
Stop-loss position.
And the consequences if the match does something we don’t want it to do.
No trade is risk-free.
The objective is to identify situations where the potential reward is disproportionately large compared with the controlled downside.
THIS ISN’T ABOUT PREDICTING FOOTBALL MATCHES
That is perhaps the biggest takeaway from this example.
We weren’t trying to predict:
Lille 2–2 PSG.
Had that been our objective, this would simply have been a successful correct-score bet.
Instead, we were trading what could happen between the 22nd minute and the final whistle.
We had positions capable of benefiting from different developments.
Lille score?
One part of the trade potentially comes alive.
PSG score?
Another part potentially benefits.
Lille reach 2–0?
The 2–0 Correct Score price can collapse.
PSG pull one back?
The 2–1 price can collapse.
PSG equalise?
The Draw position can become extremely valuable.
That’s a fundamentally different way of looking at a football match.
THE REAL POWER OF HEDGED TRADING
For me, the attraction isn’t finding a spectacular winning bet.
It’s identifying situations where data, market prices and match pathways combine to create an asymmetric trading opportunity.
The Lille v PSG match happened to travel beautifully through all three positions.
We cannot expect every trade to do that.
Nor should a 28-match sample be treated as proof of a future probability.
But the example demonstrates the principle extremely well:
Don’t just ask who is going to win.
Ask where the match can go next, how the markets will react when it gets there, and whether you can position yourself beforehand to take advantage.
That is the essence of Hedged Trading.


No comment